This document contains background information for facilitators before they run the workshop with participants. It gives some interesting information about the digital world based on statistical data.
General Objective
Preparation time for facilitator
Competence area
Name of author
Resource originally created in
ICT tools
Globally:
- 45 million servers
- 800 million server equipment devices (routers, modems…)
- 15 billion online devices in as of 2018 and 46 billion expected by 2030!
- 10 billion phones sold since 2007
- In Western Europe, there will be 8.9 connected devices per person as of 2021, as opposed to 5.3 in 2016.
(Source (in French))
In the European Union:
- 3 of 4 EU citizens use mobile devices to access the internet on the move, including 94% of all 16-24 year olds. (Source)
Uses of IT
In the European Union (data from surveys conducted between 2016 and 2018):
- 76% of people accessed the internet on a daily basis, with a further 7% on a weekly basis (but not daily)
- 71% of people aged 16 to 74 know that cookie’s can be used to trace people’s online activity
- 60% of internet users have bought good online as of 2018, representing a 13 point increase since 2013
- 90% of people aged 16-24 have used social media
- 83% of people aged 16-24 have watched Netflix
- 80% of people aged 16-24 have streamed music
Sources:
Online activity
Globally, there are:
- 8 to 10 billion emails exchanged every hour (excluding spam)
- 180 million searches on Google
Digital data (emails, downloads, videos, web requests…) travels on average 15000 kms. (Source (in French))
IT jobs
In the EU :
- By 2017, value added by the EU’s ICT sector was equivalent to 3.6 % of GDP
- Between 2012 and 2017, value added by ICT services in the EU grew each year and increased by 18.3 %, while valued added by ICT manufacturing increased by 22.5 %.
- In 2017, the largest ICT services subsector in the EU, computer programming, consultancy and related activities, was more than 10 times the size of the largest ICT manufacturing subsector, electronic components and boards.
- Of the 8 million people working in ICT, only 17% are women
Sources:
- https://ec.europa.eu/eurostat/statistics-explained/index.php/ICT_sector_-_value_added,_employment_and_R%26D#Apparent_labour_productivity
- https://eur-lex.europa.eu/legal-content/EN/TXT/?qid=1544171130419&uri=CELEX%3A52018AE2156#ntr26-C_2018440EN.01003701-E0026
IT and the environment
- Environmental impacts of ICT
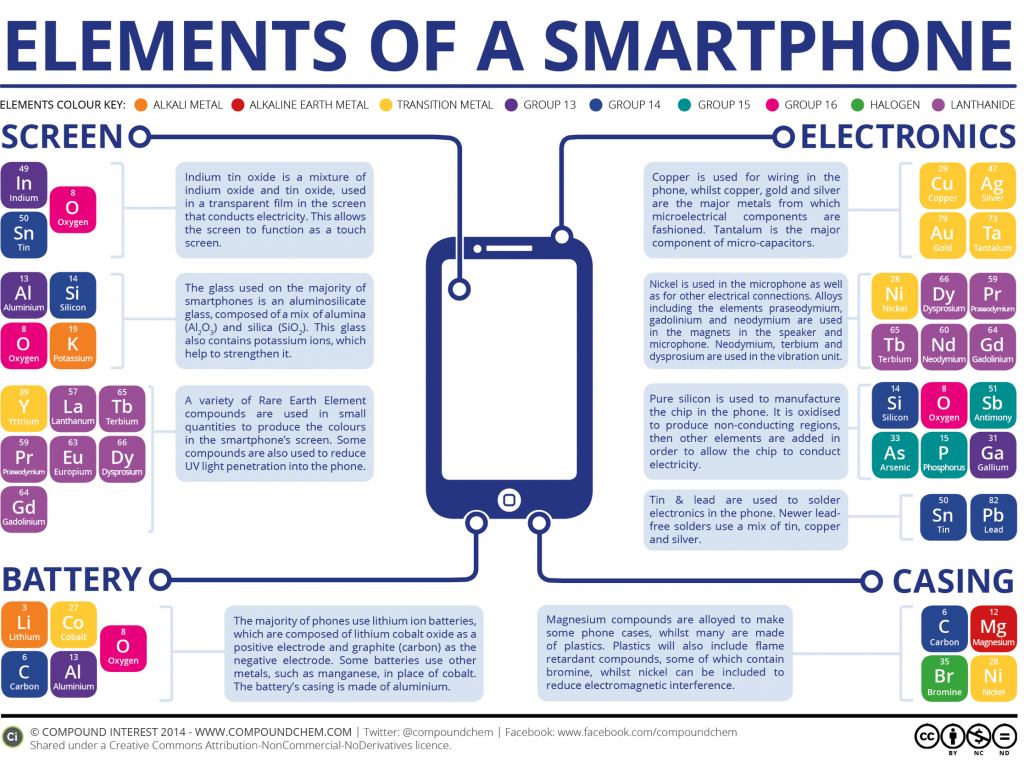
Of the carbon emissions generated by the digital sector, 25% come from data centres, 28% from network infrastructure, and 47% from consumer devices (computers, phones, tables, GPS…) (Source (in French)) Paradoxically, the smaller our devices get, the more material we use. The more complex components become, the larger their environmental impact. On average, 50 to 350 times the weight of an electronic device is required to produce that device, for example 800 kgs for a laptop computer or 500 kgs for a modem. Manufacturers of these devices use precious minerals at a unbelievable pace, such that the mines that produce these minerals espouse unacceptable working conditions and bring about significant environmental damage. (Source (in French))
- Good Practice
The best way to reduce the impact of our devices is to ensure they last as long as possible. Using a table for four years instead of two years reduces its impact by 50%. (Source (in French)) Another way to reduce impact is to choose devices based on their uses, but also due based on their energy consumption.
